(Dashboard referenced in the article)
I have no great teachings from this dashboard, but I thought it was a fun exercise and wanted to share.
Ok, technically that’s not correct. You see, I have this great dataset of pet ownership by state (well just cats and dogs, because they’re the only pets that count). There’s just one problem…
…I can’t remember where I got it from. And it isn’t attributed in my dashboard. This isn’t a good look, at all, as you should always give credit to the source of the data.
But, it’s still a fun dashboard so I’m going to proceed. Whoever you are that compiled this data, thanks!
Anyways, the dataset shows – by state – cat and dog population, as well as the number of households that have a cat or dog. And man, do we have a lot of houses with pets – 55.9% of all households!
There’s a lot of households that get it right – 42.9 million, to be exact. And then there’s a lot that get it wrong – 35.7 million.

Except that some of them have both dogs and cats, which blows my mind.
What’s most disturbing is that, though there are less households with cats, they have more cats per household.

Wait, hold on a second…did you see that dog?

You telling me you wouldn’t want ten of these??
(We don’t have ten of them…we have more than one, and we’ll leave it there)
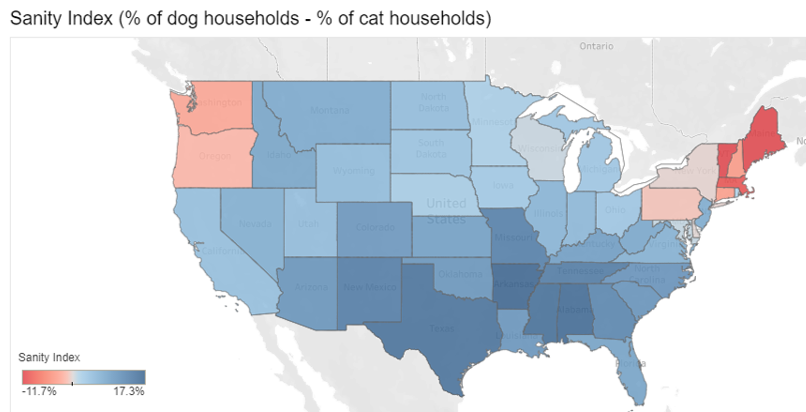
The last thing I wanted to do was to see where people have more dogs than cats. And I was pleased to see that most of the country is in the blue, with the exception of New England and the Pacific Northwest.